
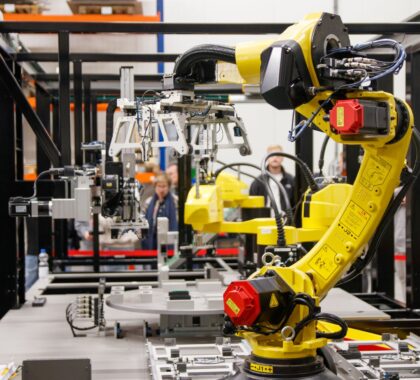
The Situation: A Plant Manager’s Decision
A plant manager at a mid‑size metal fabrication shop in Ohio watches overtime climb each quarter.
The shop runs two shifts five days a week.
Each shift employs three welders at thirty dollars an hour.
Overtime adds another ten hours per welder per week.
The manager sees the same loss repeat every month.
The loss is the extra wage cost that does not increase output.
The manager needs a number that tells whether a robot cell will stop that loss.
The manager also needs to know what the robot cannot do.
Automation cannot handle highly variable custom parts without new programming each change.
Automation cannot replace the judgment of a senior welder on complex fixtures.
The goal is not to replace staff but to redirect them to higher‑value work.
The One Number: Payback Period
The one number that decides the purchase is payback period.
Industrial robotics automation pays back when the cell cost divided by annual labor savings plus throughput value falls below your target months.
The payback period is the time required for the savings to equal the upfront cost.
If the period is shorter than the planning horizon the investment makes sense.
If it is longer the capital sits idle.
Industrial robotics automation is measured by this single metric.
No other metric captures the full trade‑off as cleanly.
Running the Arithmetic: Cell Cost Labor Displaced Throughput Gain
Start with the cell cost.
A typical six‑axis weld cell with safety fencing and integration costs two hundred fifty thousand dollars.
Next calculate labor displaced.
One welder at thirty dollars an hour works eight hours a day for two hundred fifty days a year.
That equals sixty thousand dollars per year per welder.
The cell replaces two welders on the first shift.
The annual labor savings equal one hundred twenty thousand dollars.
Add throughput gain.
The cell runs at ninety percent uptime versus seventy percent for manual welding.
The extra twenty percent uptime on a line that ships five hundred parts a day adds one hundred parts per day.
At a margin of fifty dollars per part that equals five thousand dollars per day.
Over two hundred fifty days that equals one million two hundred fifty thousand dollars per year.
The combined annual benefit is one million three hundred seventy thousand dollars.
Divide the cell cost by the annual benefit.
Two hundred fifty thousand divided by one million three hundred seventy thousand equals zero point one eight years.
That is about two months payback.
The arithmetic is open for the reader to plug in their own numbers.
Industrial robotics automation cannot handle highly variable custom parts without new programming each change.
Industrial robotics automation cannot replace the judgment of a senior welder on complex fixtures.
The goal is not to replace staff but to redirect them to higher‑value work.
For a deeper look at cell design see what we build.
When It Pencils and When It Does Not
If the cell cost rises to four hundred thousand dollars the payback stretches to three months.
Still acceptable for many shops.
If the labor rate drops to twenty dollars an hour the annual savings fall to eighty thousand dollars.
The payback becomes three point one years.
That may exceed the planning horizon.
If the throughput gain is only five percent the extra revenue drops to three hundred thousand dollars per year.
Payback becomes nine months.
The hit rate of throughput improvement matters.
A hit rate of eighty percent means the projected gain is realized eight out of ten times.
The coverage against recurring overtime loss is the real value.
The manager buys coverage against a loss that repeats each pay period.
The measure of that coverage is the hit rate of the projected savings.
Industrial robotics automation decisions hinge on these two variables.
Cell cost and hit rate together set the payback.
Acting on the Numbers
First gather actual labor rates and overtime hours from the payroll system.
Second record current uptime and scrap rates from the MES.
Third build a simple spreadsheet with the three variables: cell cost, labor savings, throughput gain.
Fourth run the payback formula.
Fifth set a threshold such as twelve months.
Sixth if the result meets the threshold move to a pilot cell.
Seventh track the hit rate during the pilot.
Eighth decide on scale based on pilot data.
The goal is not to replace staff but to free them for programming and quality tasks.
A structured assessment can accelerate this process.
AI consulting for your operation provides a rapid payback model built on your numbers.
Looking Ahead
Robot hardware costs continue to decline modestly each year.
Vision systems improve part location accuracy.
Software frameworks reduce integration time.
These trends shrink the cell cost side of the equation.
Labor rates in manufacturing regions tend to rise.
That expands the savings side.
The payback period will shorten for most applications.
The decision framework remains the same.
Run the arithmetic.
Compare to your threshold.
Act when the numbers support the move.
Industrial robotics automation will keep being evaluated by the same one number.